19장. Vision 데이터 파이프라인
실습 4 — 시각화와 보고
실습 3의 물체 표로 보고 단계를 만듭니다. 그림 여섯 장에 상자와 이름을 그린 격자, 클래스별 개수 막대, 그림마다 개수와 손질을 적은 보고표 csv 를 만듭니다. 실습 2와 실습 3을 먼저 실행해야 합니다.
1단계. 상자를 그리는 함수
from pathlib import Path
import cv2
import numpy as np
import pandas as pd
import matplotlib.pyplot as plt

plt.rcParams["font.family"] = "Malgun Gothic"
plt.rcParams["axes.unicode_minus"] = False

if not Path("out_ch19_detections.csv").exists():
    raise SystemExit("out_ch19_detections.csv 가 없습니다. 실습 3을 먼저 실행하세요")

CONFIG = {"seed": 19}
detections = pd.read_csv("out_ch19_detections.csv")
prepped = pd.read_csv("out_ch19_prepped.csv", keep_default_na=False)

# 상자 색(BGR): bolt 초록, nut 다홍, washer 보라
COLORS = {"bolt": (76, 139, 95), "nut": (38, 93, 254), "washer": (190, 125, 142)}

def draw_boxes(img, boxes, scale=1.0):
    """그림을 복사해 상자와 '이름 신뢰도' 를 그린다. boxes 는 원래 좌표라 scale 을 곱해 다듬은 그림에 맞춘다."""
    canvas = img.copy()
    for b in boxes.itertuples():
        name = b[2]                                         # class 열(파이썬 낱말이라 번호로 꺼낸다)
        p1 = (round(b.x1 * scale), round(b.y1 * scale))
        p2 = (round(b.x2 * scale), round(b.y2 * scale))
        cv2.rectangle(canvas, p1, p2, COLORS[name], 2)
        cv2.putText(canvas, f"{name} {b.conf:.2f}", (p1[0], max(p1[1] - 4, 10)),
                    cv2.FONT_HERSHEY_SIMPLEX, 0.4, COLORS[name], 1, cv2.LINE_AA)
    return canvas

row = prepped[prepped["file"] == "belt_018.png"].iloc[0]
one = draw_boxes(cv2.imread(f"out_ch19_prepped/{row.saved}"), detections[detections["file"] == row.file], row.scale)
print("상자를 그린 그림:", one.shape, "· 상자", int((detections["file"] == row.file).sum()), "개")상자를 그린 그림: (240, 320, 3) · 상자 6 개2단계. 여섯 장 격자 저장하기
# 씨앗을 고정해 여섯 장을 고른다: 다시 돌려도 같은 그림이 뽑힌다
rng = np.random.default_rng(CONFIG["seed"])
picked = sorted(rng.choice(prepped["file"].tolist(), 6, replace=False).tolist())
tiles = []
for name in picked:
    row = prepped[prepped["file"] == name].iloc[0]
    tile = draw_boxes(cv2.imread(f"out_ch19_prepped/{row.saved}"), detections[detections["file"] == name], row.scale)
    cv2.putText(tile, name, (6, 232), cv2.FONT_HERSHEY_SIMPLEX, 0.45, (255, 255, 255), 1, cv2.LINE_AA)
    tiles.append(tile)
grid = cv2.vconcat([cv2.hconcat(tiles[:3]), cv2.hconcat(tiles[3:])])   # 2x3 격자(2차시)
cv2.imwrite("out_ch19_boxes.png", grid)
print("고른 그림:", picked)
print("저장: out_ch19_boxes.png", grid.shape)

plt.figure(figsize=(12, 6.2))
plt.imshow(cv2.cvtColor(grid, cv2.COLOR_BGR2RGB))
plt.axis("off")
plt.show()고른 그림: ['belt_005.png', 'belt_006.png', 'belt_007.png', 'belt_008.jpg', 'belt_017.png', 'belt_018.png']
저장: out_ch19_boxes.png (480, 960, 3)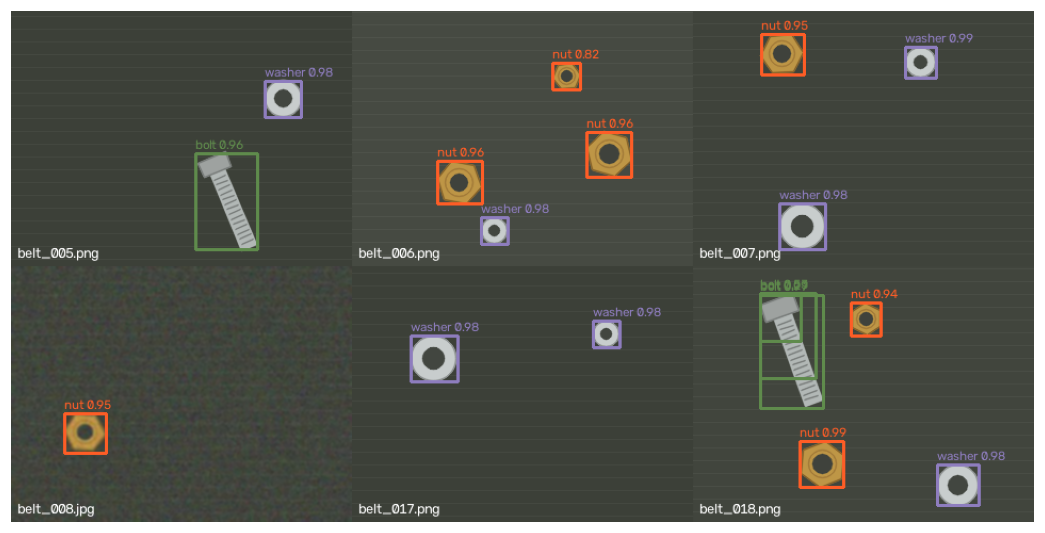
3단계. 클래스별 개수와 그림당 개수 그래프
fig, axes = plt.subplots(1, 2, figsize=(11, 4), layout="constrained")
# 왼쪽: 클래스별 개수. reindex 로 bolt, nut, washer 순서를 고정한다
counts = detections["class"].value_counts().reindex(["bolt", "nut", "washer"], fill_value=0)
axes[0].bar(counts.index, counts.values)
for x, v in enumerate(counts.values):
    axes[0].text(x, v + 0.3, str(int(v)), ha="center")
axes[0].set_ylim(0, counts.max() * 1.2)
axes[0].set_title("클래스별 찾은 개수")
# 오른쪽: 그림당 물체 수. 아무것도 못 찾은 그림도 0 으로 넣는다
per_image = detections.groupby("file").size().reindex(prepped["file"], fill_value=0)
axes[1].hist(per_image.values, bins=np.arange(-0.5, per_image.max() + 1.5, 1))
axes[1].set_xlabel("그림 한 장의 물체 수")
axes[1].set_ylabel("그림 수")
axes[1].set_title("그림당 물체 수")
plt.show()
print("클래스별:", counts.to_dict())
print("그림당 물체 수:", per_image.value_counts().sort_index().to_dict())클래스별: {'bolt': 16, 'nut': 16, 'washer': 25}
그림당 물체 수: {1: 4, 2: 3, 3: 3, 4: 5, 5: 1, 6: 1, 7: 1}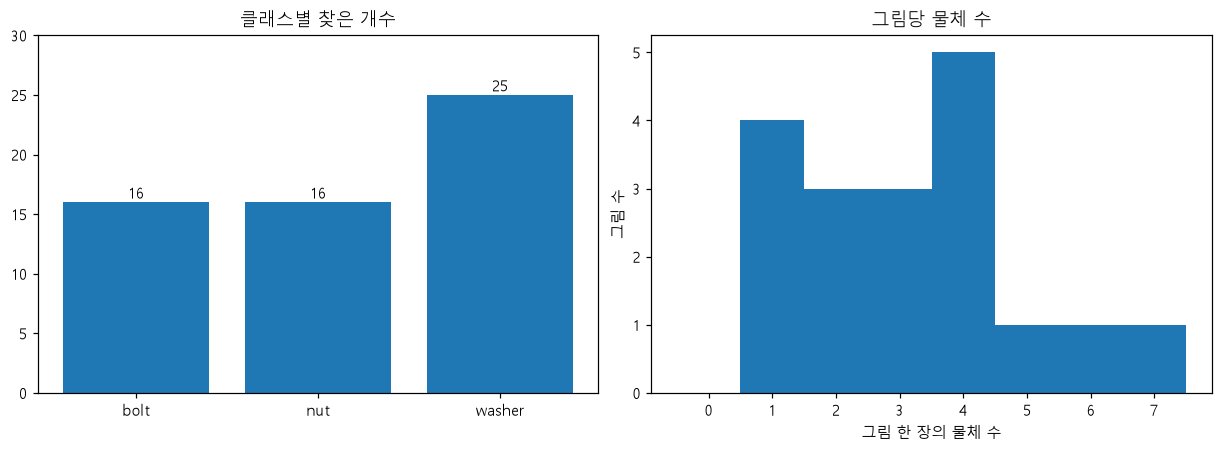
4단계. 그림별 보고표 저장하기
# 그림마다 한 행: 찾은 수, 클래스별 수, 가장 낮은 신뢰도, 다듬기 손질
table = pd.crosstab(detections["file"], detections["class"]).reindex(
    index=prepped["file"], columns=["bolt", "nut", "washer"], fill_value=0)
table["찾은 수"] = table.sum(axis=1)
table["최저 신뢰도"] = detections.groupby("file")["conf"].min().reindex(prepped["file"]).round(3)
table["손질"] = prepped.set_index("file")["notes"]
table.to_csv("out_ch19_summary.csv", encoding="utf-8-sig")
print(table.head(6).to_string())
print("저장: out_ch19_summary.csv", table.shape)class bolt nut washer 찾은 수 최저 신뢰도 손질
file
belt_001.png 0 0 1 1 0.989
belt_002.png 1 2 0 3 0.886
belt_003.png 0 1 2 3 0.962
belt_004.png 1 0 1 2 0.963 감마 0.7
belt_005.png 1 0 1 2 0.957
belt_006.png 0 3 1 4 0.820
저장: out_ch19_summary.csv (18, 6)코드 설명
draw_boxes는 원래 좌표로 저장한 상자에scale을 곱해 다듬은 그림(320×240) 위에 그립니다. 실습 3에서 나눴던 비율을 거꾸로 곱하는 셈입니다. 그림은copy()로 복사해서 그립니다.rng.choice(..., 6, replace=False)는 겹치지 않게 여섯 장을 고릅니다. 씨앗을 CONFIG 에 두었으므로 보고 그림이 매번 같습니다.reindex(..., fill_value=0)는 아무것도 못 찾은 그림이나 클래스도 0 으로 넣어 표의 모양을 고정합니다. 그래야 "못 찾은 그림"이 보고서에서 빠지지 않습니다.- 격자의
belt_018.png에서 bolt 하나에 초록 상자가 세 겹으로 그려진 것이 보입니다. 실습 3에서 개수가 2개 많았던 까닭이 이 겹친 상자이고, 숫자 표만으로는 "어디가 틀렸는지"를 알기 어려워 상자 그림을 함께 보는 것입니다. 다른 다섯 장은 상자가 부품에 꼭 맞습니다. 그림당 물체 수는 4개인 그림이 5장으로 가장 많고, 6개와 7개인 그림(겹친 상자가 있는 두 장)이 하나씩 있습니다. 보고표의 "최저 신뢰도" 열을 보면 이런 그림을 빨리 찾을 수 있습니다.